On a recent project we had automated the creation of environments on Azure using ARM templates, and had wrapped with a few quite basic PowerShell scripts for use in development/testing and within continuous integration/delivery. Some engineers were reporting issues with execution of the scripts – issues such as syntax errors that were pointing to version issues. It turned out that it was actually quite easy for an engineer who randomly installs stuff to play with (and yes I do mean me) to have multiple versions installed and competing!
Firstly to get a view of the current state within PowerShell you can use:
1 Get-Module -ListAvailable Azure
2
1 Get-Module -ListAvailable Azure
This should output something like:
1     Directory: C:\Program Files\WindowsPowerShell\Modules
2
3
4 ModuleType Version    Name                                ExportedCommands
5 ---------- -------    ----                                ----------------
6 Script     3.1.0      Azure                               {Get-AzureAutomationCertificate, Get-AzureAutomationConnec...
Azure PowerShell uses semantic versioning as detailed in https://docs.microsoft.com/en-gb/azure/powershell-install-configure and anything less than 2.1.0 is not designed to run side by side. If you find yourself with a version below 2.1.0 uninstall the "Microsoft Azure Powershell" feature using "Programs and Features".
1     Directory: C:\Program Files\WindowsPowerShell\Modules
2
3
4 ModuleType Version    Name                                ExportedCommands
5 ---------- -------    ----                                ----------------
6 Script     3.1.0      Azure                               {Get-AzureAutomationCertificate, Get-AzureAutomationConnec...
Then to install the latest version the recommended method is to use the PowerShell gallery, you can find the latest version using:
Then install using:
1 Install-Module Azure –AllowClobber
Then you can identify the version of everything Azure installed using:
1 Get-Module -ListAvailable Azure*
I have been using (and loving) App Insights a lot recently and one of the things that have really impressed me is the capability and power of the queries when analysing usage patterns. One thing that caught me out however, was counting the number of requests when the sampling was active – in my case when the site was getting a lot of traffic during load testing.
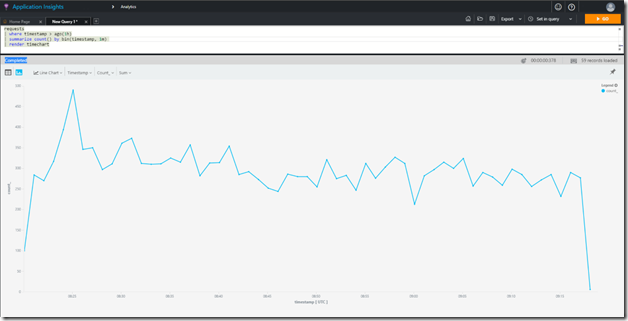
Creating a simple chart showing number of requests per minute over the last hour using:
1 requests
2 | where timestamp > ago(1h)
3 | summarize count() by bin(timestamp, 1m)
4 | render timechart
5
1 requests
2 | where timestamp > ago(1h)
3 | summarize count() by bin(timestamp, 1m)
4 | render timechart
Was showing far less than anticipated after my load tests?

Turns out (if you actually read the docs) this is directly called out:
https://docs.microsoft.com/en-us/azure/application-insights/app-insights-analytics-reference#count
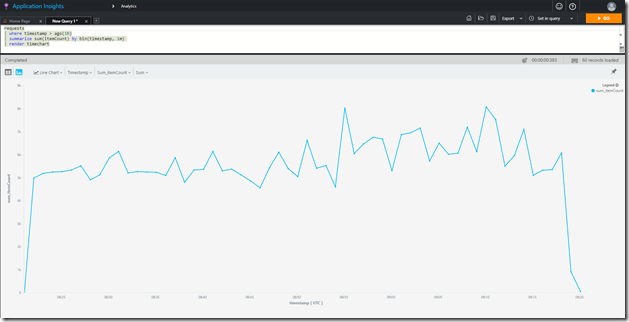
So remember to use the sum(itemCount) approach:
1 requests
2 | where timestamp > ago(1h)
3 | summarize sum(itemCount) by bin(timestamp, 1m)
4 | render timechart

Fairly significant difference!
1 requests
2 | where timestamp > ago(1h)
3 | summarize count() by bin(timestamp, 1m)
4 | render timechart
5